Server card examples
Visualization
These server cards are intended to bring the most important system information together in one compact Home Assistant dashboard. The completed set will cover CPU load, memory use, network traffic, and disk activity, making it possible to check both the current state and recent changes without opening a separate monitoring application.
The first card in the set focuses on individual CPU cores. It places four related values in one grid and uses color to make rising load immediately visible. The next cards will use horseshoes and history graphs where they best fit the measurement: gauges for values with a clear capacity, and sparklines for activity and trends over time.
This example is still being expanded. The CPU card below is available now; memory, network, and disk cards will be added to the same server overview.
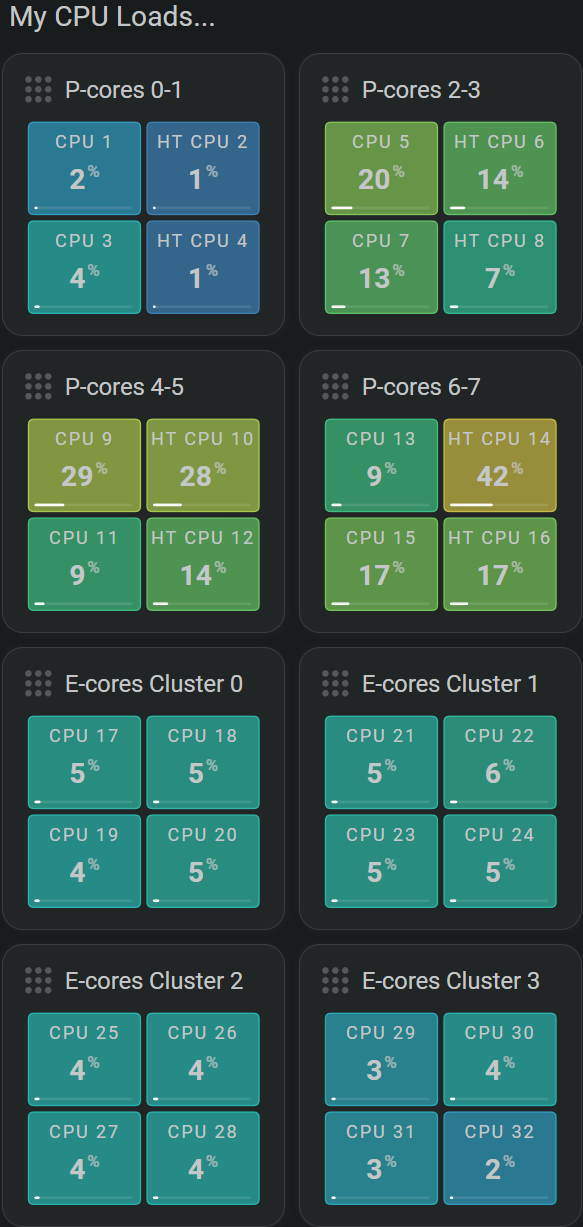
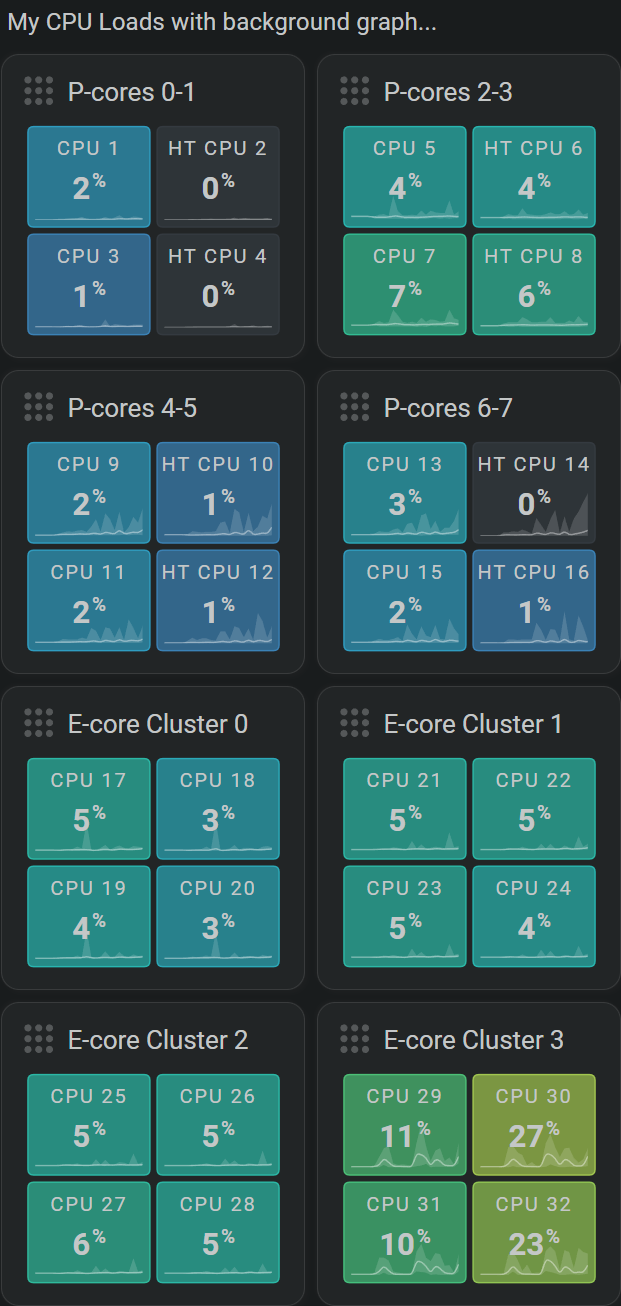
| Description | Aspect ratio |
|---|---|
| Displays the load of four CPU cores from one server. | 1/1 |
The card's building blocks
Demonstrated functionality
| Feature | Demonstrated use |
|---|---|
Required entities
This example uses the entities supplied by the Beszel API integration.
YAML definition for card #070
Example definition to use within view
/