Area chart
An Area chart is one way to draw Sparkline history. It shows the trend as a line with a filled surface underneath, which gives the size of the value more visual weight than a line alone.
This page shows how to select the Area chart, choose a solid or faded fill, show the minimum-to-maximum range, and control the chart colors.
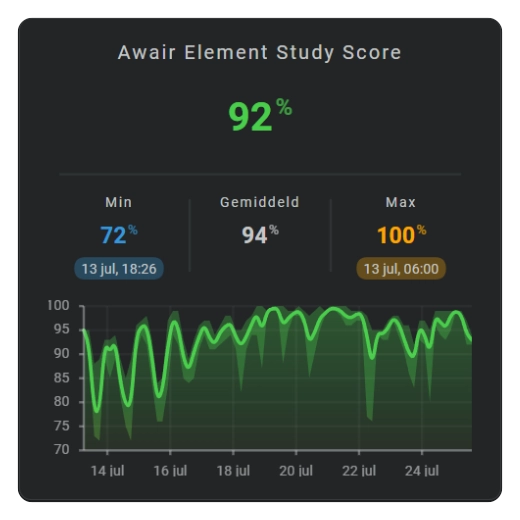
See: Sparkline History Template Card #060
Show an area chart
Use an area chart when the filled shape of the history should emphasize magnitude as well as the trend line.
Fade the fill
Use a fading fill when a solid area is visually too heavy or hides other graph details.
Show or hide the line
Use show.line to keep or remove the line along the area. Use line.line_width to change its thickness.
Show the variation inside each interval
Show the min/max band when the filled average area hides short peaks and dips inside each displayed interval.
Change the area color
Use fixed styling or the shared color-stop modes. colorstopgradient maps colors across the visible value range.
Configuration options
Required applies to the specific form described by that table: Yes means you need the field for that form; No means you can leave it out. Not set means the card adds no explicit value when the option is omitted.
| Option | Type | Required | Default | Description |
|---|---|---|---|---|
sparkline.show.chart_type | area | Yes | line | Set this to area to select this chart family; omitting it leaves the Sparkline as the default Line chart. |
sparkline.show.item_style | auto, fixed, colorstop, colorstopinterpolated, colorstopgradient | No | auto | auto uses the chart's normal automatic color; fixed uses the configured fixed area color; colorstop picks the discrete stop color for the current value; colorstopinterpolated blends one color between neighboring stops for the current value; colorstopgradient draws the configured value colors across the graph. |
sparkline.show.line | boolean | No | true | Shows the line along the area. |
sparkline.show.fill | solid, fade | No | solid | solid keeps one opacity through the filled Area; fade reduces the fill opacity away from the value line. |
sparkline.show.points | boolean | No | false | Shows one point for each displayed time interval on top of the Area chart. |
sparkline.area.show.minmax | boolean | No | false | Shows the minimum-to-maximum variation inside each interval instead of only its aggregated value. |
sparkline.area.color_filter | mapping | No | Not set | Adjusts area color. |
sparkline.area.minmax.color_filter | mapping | No | Not set | Adjusts min/max color. |
sparkline.line.line_width | number | No | 1 | Thickness of the line along the area. |
sparkline.state_values.smoothing | boolean | No | true | true draws smooth connections between interval values; false connects them with straight segments. |