Barcode chart
A Barcode chart is one way to draw Sparkline history when color matters more than numeric height. Each time interval becomes a colored column, so changes between ranges or states can be read quickly without a conventional Y-axis.
This page shows how to create the barcode, choose its value colors, control spacing/detail, and use the available barcode variants.
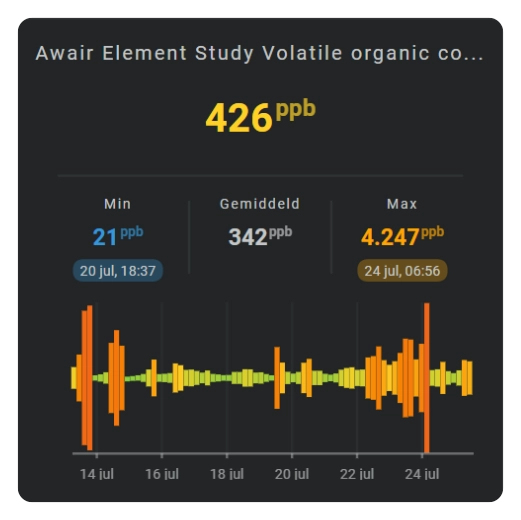
Show a barcode
Use a barcode when each time interval should appear as a narrow colored column rather than a connected line or filled area.
Choose how the columns use the height
Set chart_variant:
| Variant | Result |
|---|---|
| not set | Full chart height |
audio | Grows above and below the center |
stalactites | Grows downward from the top |
stalagmites | Grows upward from the bottom |
Change the spacing
Use barcode.column_spacing to add or remove visual space between time intervals.
Add a time axis
Barcode supports the X/time axis and X labels. See Axes and grid.
Configuration options
Required applies to the specific form described by that table: Yes means you need the field for that form; No means you can leave it out. Not set means the card adds no explicit value when the option is omitted.
| Option | Type | Required | Default | Description |
|---|---|---|---|---|
sparkline.show.chart_type | barcode | Yes | line | Set this to barcode to select this chart family; omitting it leaves the Sparkline as the default Line chart. |
sparkline.show.chart_variant | audio, stalactites, stalagmites | No | Not set | Omit it for full-height columns; audio grows around the center, stalactites grows down from the top, and stalagmites grows up from the bottom. |
sparkline.barcode.column_spacing | number | No | 1 | Space between columns. |
sparkline.color_stops | mapping | No | Not set | Maps each interval value or state to the color of its barcode column. |
sparkline.colorstops_transition | smooth, hard | No | smooth | smooth blends between neighboring numeric color stops; hard switches directly from one stop color to the next. |
period.calendar.bins.per_hour / period.rolling_window.bins.per_hour | number/auto | No | auto | Controls how many barcode columns are drawn per hour; more bins preserve more short changes. |
sparkline.show.axis.x | boolean | No | false | true shows the time axis; false hides it. |
sparkline.show.labels.x | boolean | No | false | true shows time labels; false hides them. |