Equalizer chart
An Equalizer chart is one way to draw Sparkline history as discrete value levels. Each time interval becomes a vertical stack of blocks, making changes in level visible without drawing a continuous line or area.
This page shows how to select the Equalizer chart, choose the number and shape of levels, control spacing, and color the levels from their values.
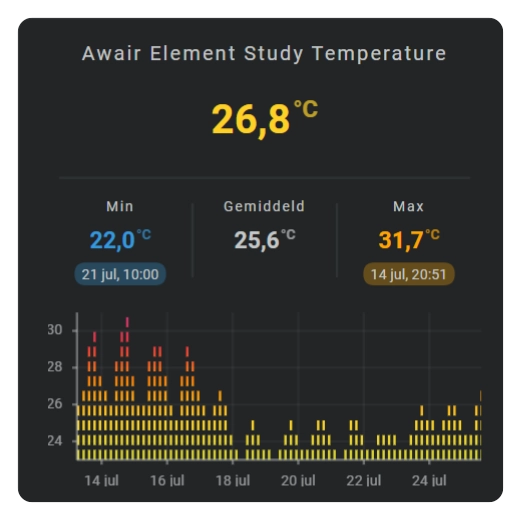
See: Sparkline History Template Card #060
Show an equalizer
Use an equalizer when values should be read as stacked levels instead of exact line positions.
Change the number of levels
value_buckets controls how many vertical levels are available.
Change the block shape and spacing
Use square for square/rounded level shapes, column_spacing between time intervals, and row_spacing between value levels.
Add value colors
Color the levels when the equalizer should also communicate ranges such as low, normal, and high.
Add a background level track
equalizer.background.show.item_style controls optional background blocks for every available level:
none— no background level blocks.fixed— usesequalizer.background.color.colorstopsegments— uses hard color-stop sections based on each level's value.lineargradient— spreads the configured colors evenly across the available levels.colorstopgradient— smoothly interpolates colors according to the configured color-stop values.
Configuration options
Required applies to the specific form described by that table: Yes means you need the field for that form; No means you can leave it out. Not set means the card adds no explicit value when the option is omitted.
| Option | Type | Required | Default | Description |
|---|---|---|---|---|
sparkline.show.chart_type | equalizer | Yes | line | Set this to equalizer to select this chart family; omitting it leaves the Sparkline as the default Line chart. |
sparkline.equalizer.value_buckets | integer | No | 10 | Number of stacked levels available for representing the value; more levels give finer visual steps. |
sparkline.equalizer.square | boolean | No | false | false draws rounded level blocks; true draws square level blocks. |
sparkline.equalizer.column_spacing | number | No | 1 | Space between time intervals. |
sparkline.equalizer.row_spacing | number | No | 1 | Space between levels. |
sparkline.equalizer.background.show.item_style | none, fixed, colorstopsegments, lineargradient, colorstopgradient | No | none | Hides background levels, uses one fixed color, uses hard value-based color sections, spreads colors evenly, or interpolates them by configured stop values. |
sparkline.equalizer.background.color | color | No | var(--divider-color) | Fixed background-level color used when background.show.item_style: fixed. |
sparkline.color_stops | mapping | No | Not set | Changes level colors with the value so ranges such as low, normal, and high remain visible. |
sparkline.colorstops_transition | smooth, hard | No | smooth | smooth blends between neighboring numeric color stops; hard switches directly from one stop color to the next. |