Radial barcode chart
A Radial barcode is a circular form of Sparkline history. Each time interval becomes a colored segment around an arc or circle, so time is read around the ring instead of from left to right.
This page shows how to select the Radial barcode, choose its inward/outward variant and segment shape, control the arc and spacing, apply value colors, and add a time scale around the ring.
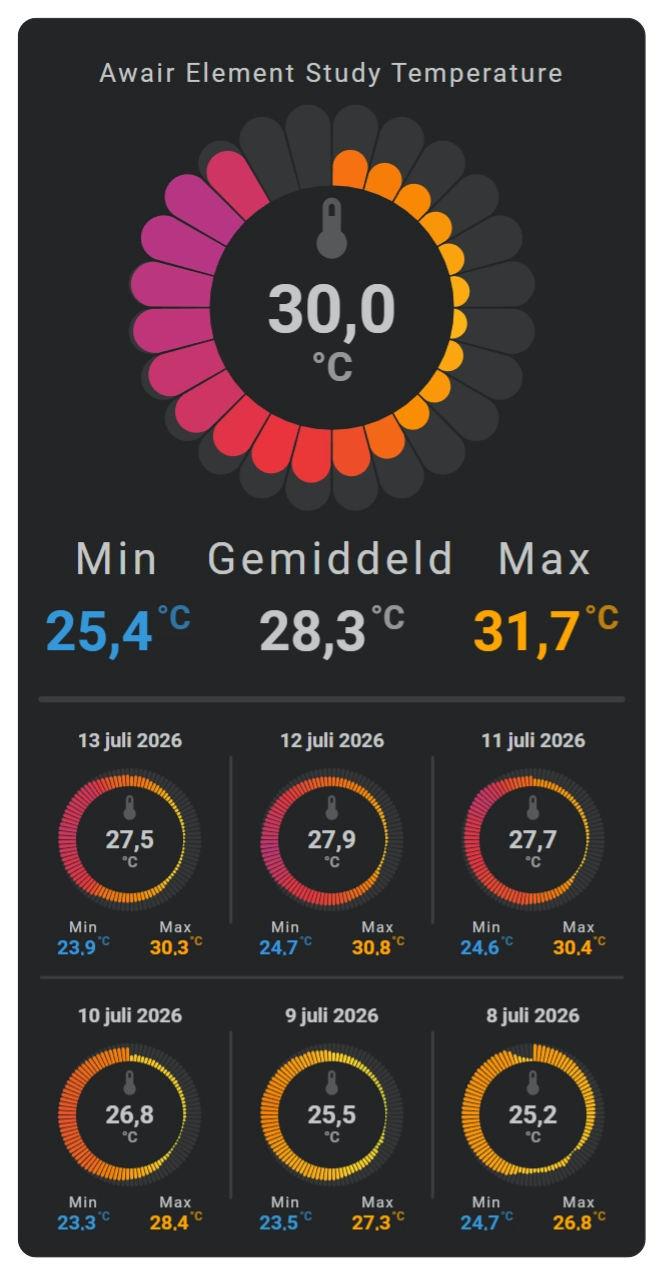
Show a radial barcode
Use a radial barcode when each time interval should be a separate segment arranged around an arc.
Choose how values grow in the ring
Set chart_variant:
| Variant | Result |
|---|---|
fixed | Every segment has the same radial depth |
sunburst / sunburst_centered | Values grow inward and outward |
sunburst_outward | Values grow outward |
sunburst_inward | Values grow inward |
Choose the segment shape
Set chart_viz:
| Visualization | Result |
|---|---|
bar | Straight radial bars |
flower | Rounded petal-like segments |
flower2 | Second flower shape |
rice_grain | Rounded seed-like segments |
Change the ring size and spacing
Use radial_barcode.size, line_width, and column_spacing to change the radial depth, segment stroke, and gap between intervals.
Add a time scale
Add the radial time scale when the viewer needs to know where particular times sit around the arc.
Configuration options
Required applies to the specific form described by that table: Yes means you need the field for that form; No means you can leave it out. Not set means the card adds no explicit value when the option is omitted.
| Option | Type | Required | Default | Description |
|---|---|---|---|---|
sparkline.show.chart_type | radial_barcode | Yes | line | Set this to radial_barcode to select this chart family; omitting it leaves the Sparkline as the default Line chart. |
sparkline.show.chart_variant | fixed, sunburst, sunburst_centered, sunburst_outward, sunburst_inward | No | fixed appearance when omitted | fixed keeps every segment at full ring depth; sunburst and sunburst_centered vary depth around the ring center; sunburst_outward grows outward; sunburst_inward grows inward. |
sparkline.show.chart_viz | bar, flower, flower2, rice_grain | No | bar | bar uses straight ring segments; flower and flower2 use rounded petal shapes; rice_grain rounds both sides into a seed-like shape. |
sparkline.radial_barcode.arc_degrees | number | No | 360 | Amount of the circle used by the radial barcode; values must be greater than 0 and at most 360. |
sparkline.radial_barcode.rotate | number | No | 0 | Rotates where the radial barcode starts around the circle. |
sparkline.radial_barcode.size | number | No | 5 | Radial depth. |
sparkline.radial_barcode.line_width | number | No | 0 | Segment stroke width. |
sparkline.radial_barcode.column_spacing | number | No | 1 | Angular gap between intervals. |
sparkline.show.grid.x | boolean | No | false | true shows time-grid spokes; false hides them. |
sparkline.show.axis.x | boolean | No | false | true shows the outer time-axis arc; false hides it. |
sparkline.show.tickmarks.x | boolean | No | false | true shows time-axis tick marks; false hides them. |
sparkline.show.labels.x | boolean | No | false | true shows time labels; false hides them. |
x_axis.labels.orientation | horizontal, arc | No | horizontal | horizontal keeps time labels level; arc makes them follow the radial time axis. |
sparkline.color_stops | mapping | No | Not set | Value/state colors. |
period.calendar.bins.per_hour / period.rolling_window.bins.per_hour | number/auto | No | auto | Controls how many angular history segments are drawn per hour; more bins preserve shorter changes. |